Diagrams for exploring and planning
Choose a diagram that helps you organise your ideas, understand a problem, or explain what you want to build. Each type can be created and edited in Project Studio, directly in your browser.
Mind map
Explore an idea by branching into related topics, questions, and tasks. Use a mind map to brainstorm, organise research, or break a project into manageable parts before deciding how those parts fit together.
Create a mind map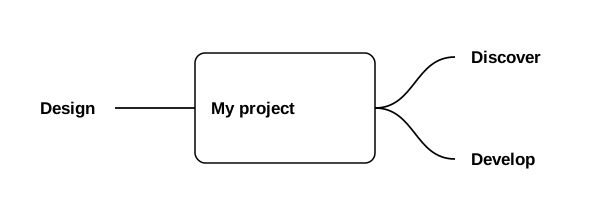
Website information architecture
Organise a website’s pages and sections into a clear hierarchy. Use information architecture to decide what content belongs on the site, how it is grouped, and where visitors should expect to find it.
Create information architecture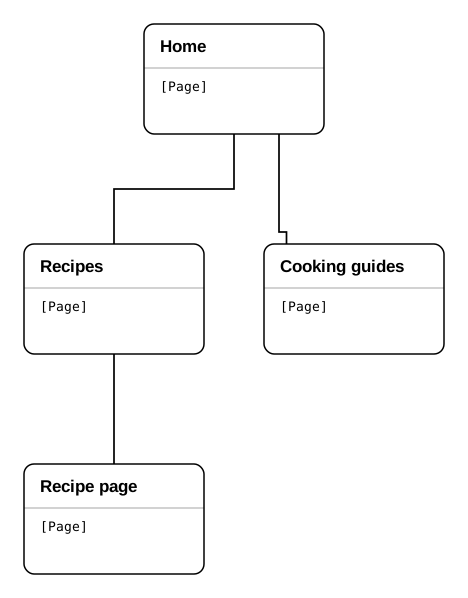
Website page flow
Show how a visitor moves between pages or screens to complete a task. Use page flow to plan journeys such as finding a recipe or booking a workshop, including alternative paths and returns.
Create a page flow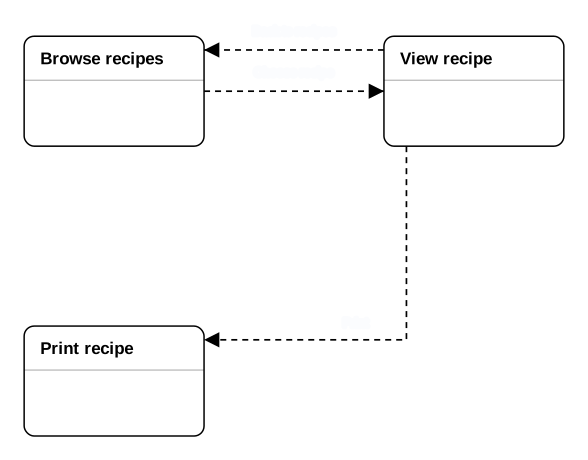
Ontology
Define the concepts in a subject, their properties, and the relationships between them. Use an ontology to agree on terminology, make assumptions explicit, and sketch the information an application needs to work with.
Create an ontology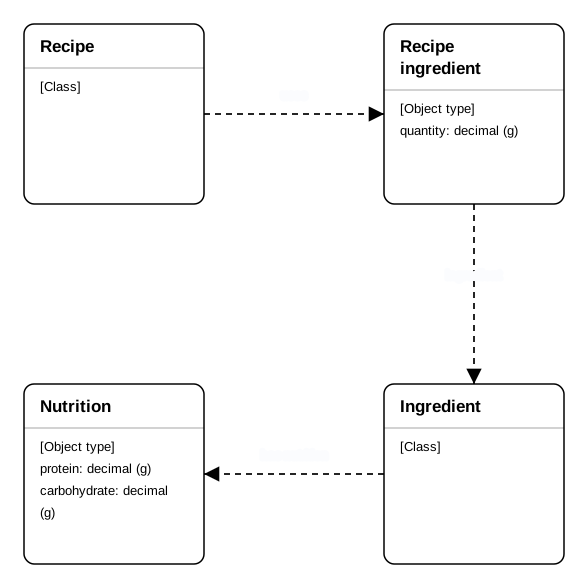
Entity relationships
Describe the records a system stores, the information each record contains, and how records connect. Use an entity-relationship diagram to sketch a database structure and discuss how information should be organised before building it.
Create an entity-relationship diagram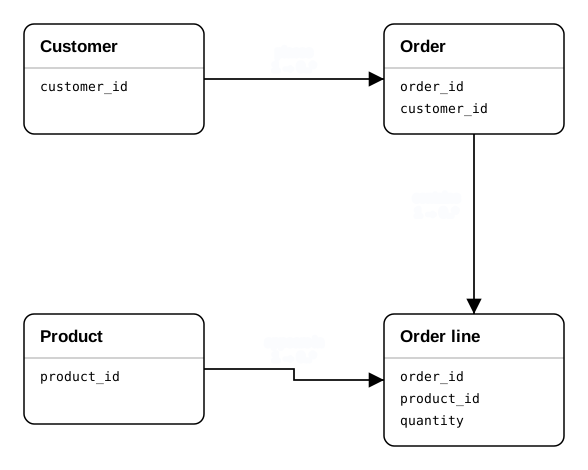
Requirements traceability
Connect requirements with design decisions, tests, and supporting evidence. Use a requirements traceability diagram to explain why a design choice exists, identify gaps in coverage, and understand what might be affected when a requirement changes.
Create a requirements diagram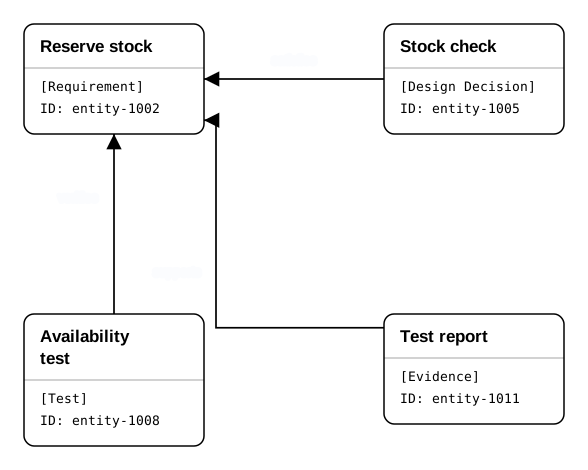
State workflow
Show the states something can occupy and the events that move it between them. Use a state workflow to plan processes such as approvals or bookings, including the conditions that allow each change.
Create a state workflow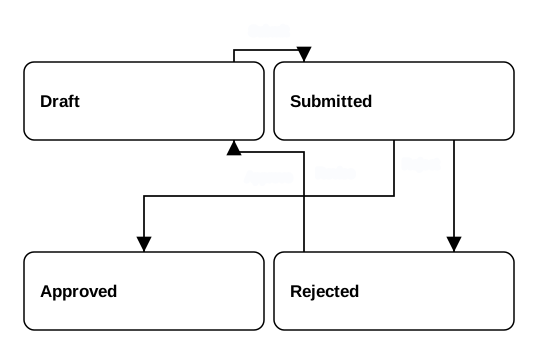
Ordered request
Show requests and responses between participants in the order they happen. Use an ordered request diagram to explain how people, applications, or services interact while completing a task, such as reserving stock or placing an order.
Create an ordered request diagram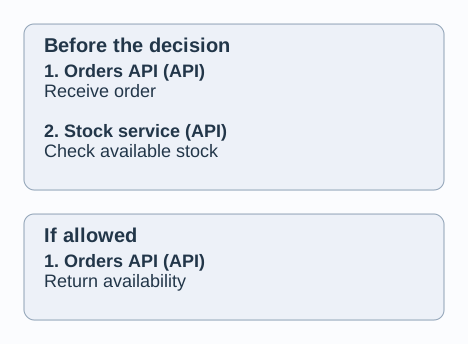
Gantt chart
Arrange tasks over time to show their duration, dependencies, and progress. Use a Gantt chart to plan a project schedule, see which activities can overlap, and understand how one task affects the next.
Create a Gantt chart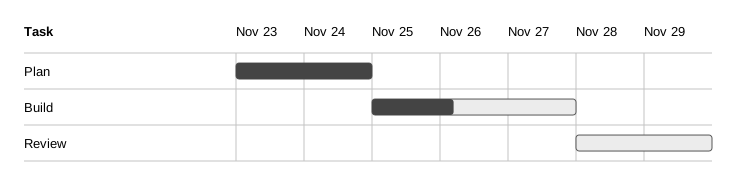
C4 diagrams describe a system at progressively closer levels of detail.
C4 · Landscape
Show the systems in an organisation or wider ecosystem and the people who use them. Use a landscape diagram to understand the overall environment, identify connections, and place a proposed project in context.
Create a landscape diagram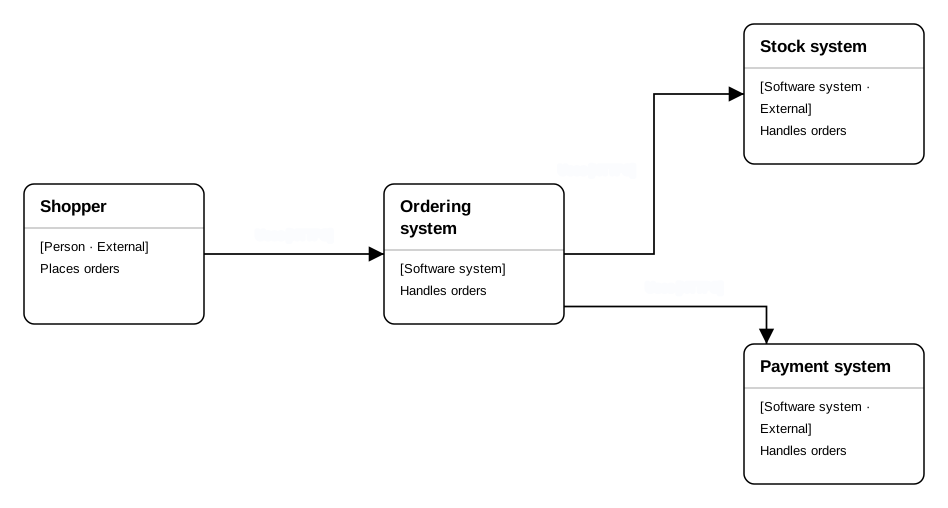
C4 · Context
Focus on one system and show the people and external systems it interacts with. Use a context diagram to explain its purpose, establish its boundaries, and agree on responsibilities before exploring the technical design.
Create a context diagram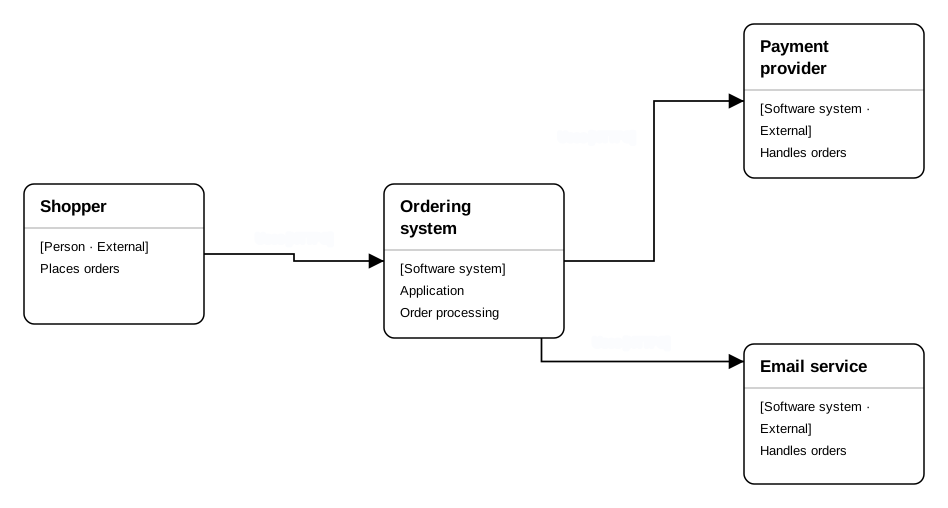
C4 · Container
Show the applications, services, and data stores that make up a system, together with their connections. Use a container diagram to explain the main technical building blocks and how responsibilities are divided between them.
Create a container diagram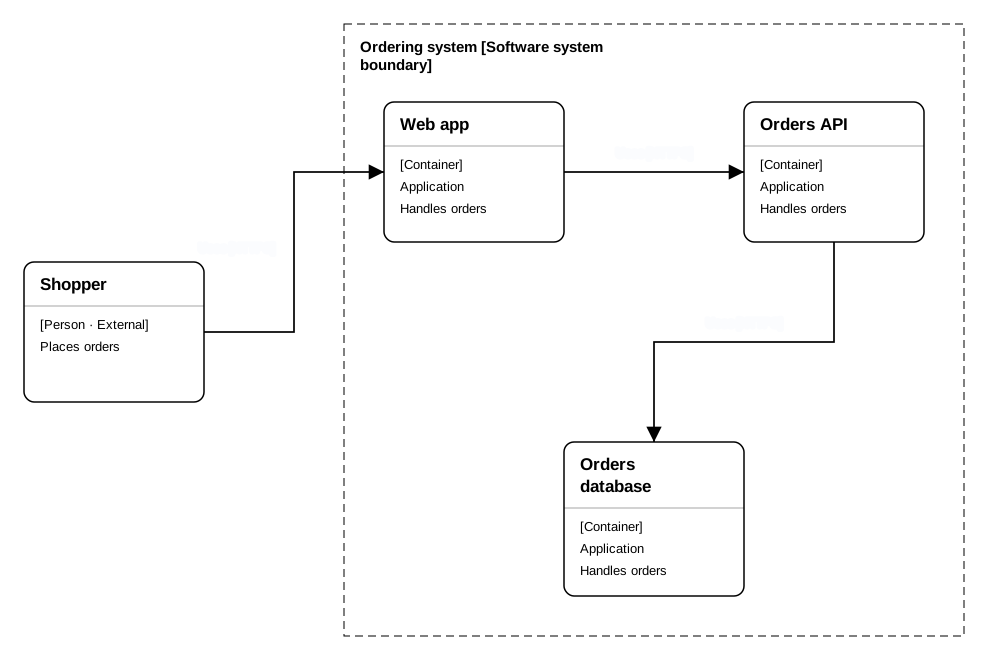
C4 · Component
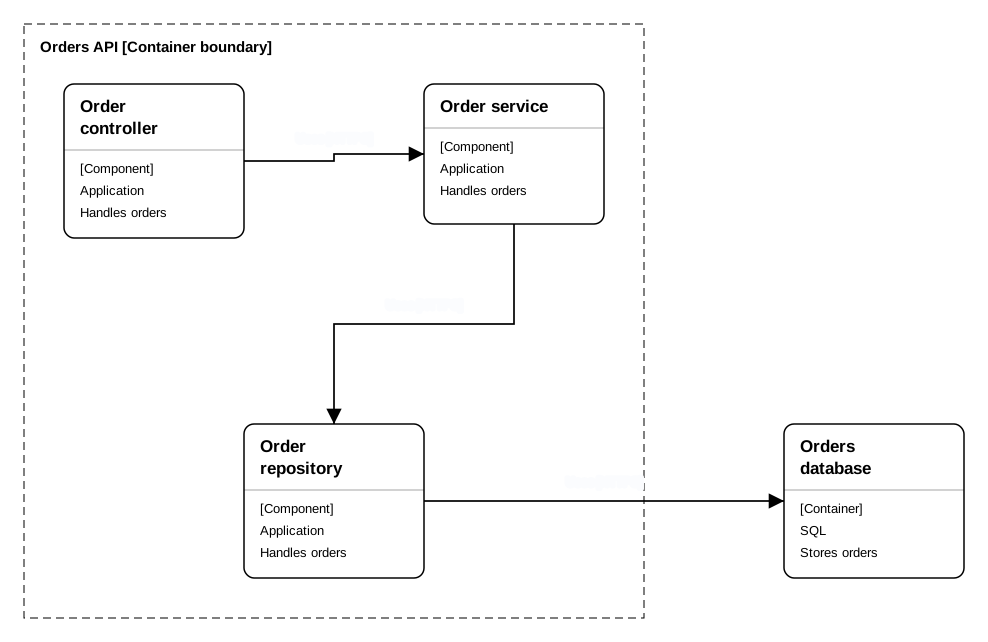
Look inside one application or service to show its components and how they interact. Use a component diagram to plan internal responsibilities, discuss dependencies, and explain how that part of the system is organised.
Create a component diagram