A space for connected thinking
Give your ideas a little structure.
Communicate ideas clearly
When an idea has a lot of moving parts, it can be hard to explain how they fit together. A diagram can make those relationships visible. These four examples show how to explore an idea with a mind map, define concepts with an ontology, show what can happen next with a state workflow, and plan when work happens with a Gantt chart.
Open any example to try the editor on your own copy. Try adding a topic, changing a relationship, or adjusting a task’s dates. Your edits stay in this browser.
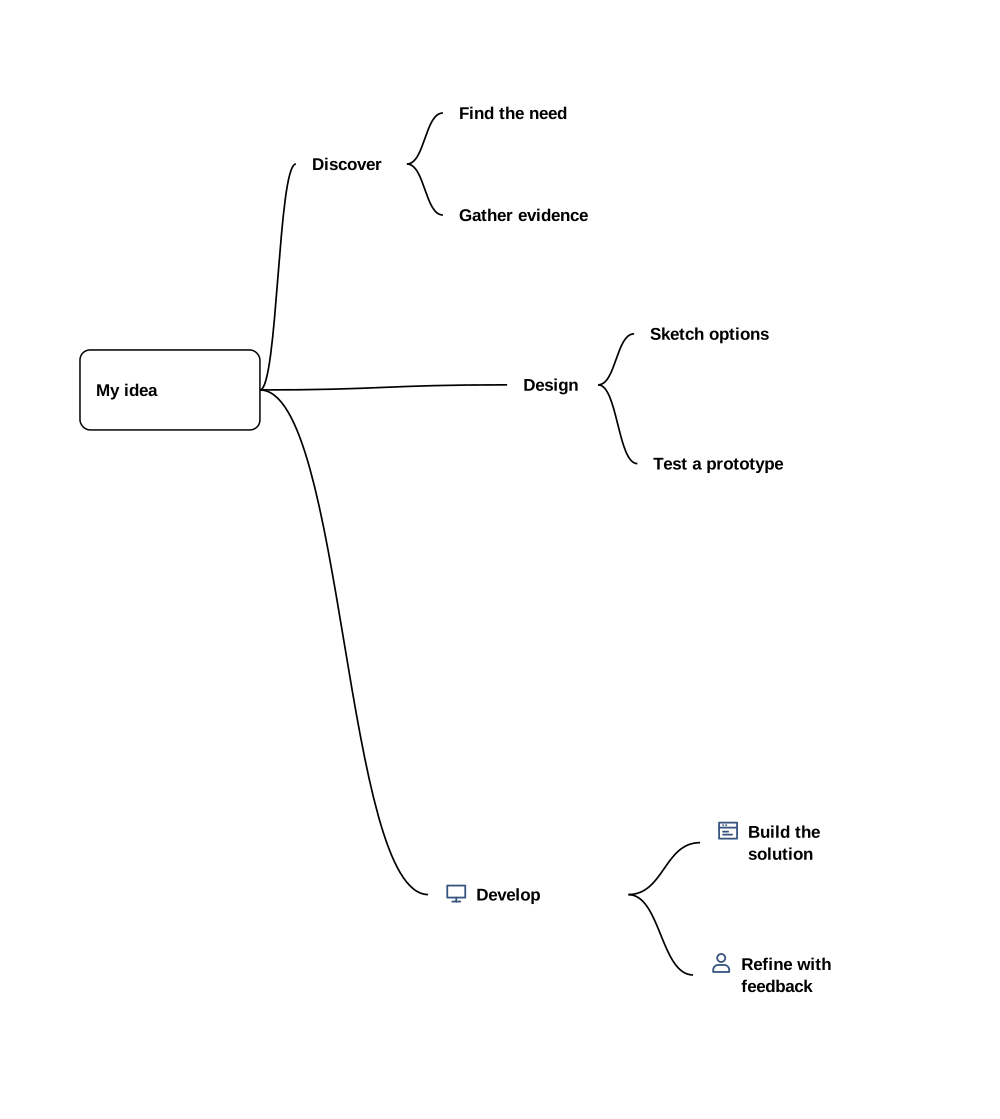
Mind map
A mind map starts with one idea and branches into related topics. Use one to explore a problem or turn a rough idea into a plan.
Ontology
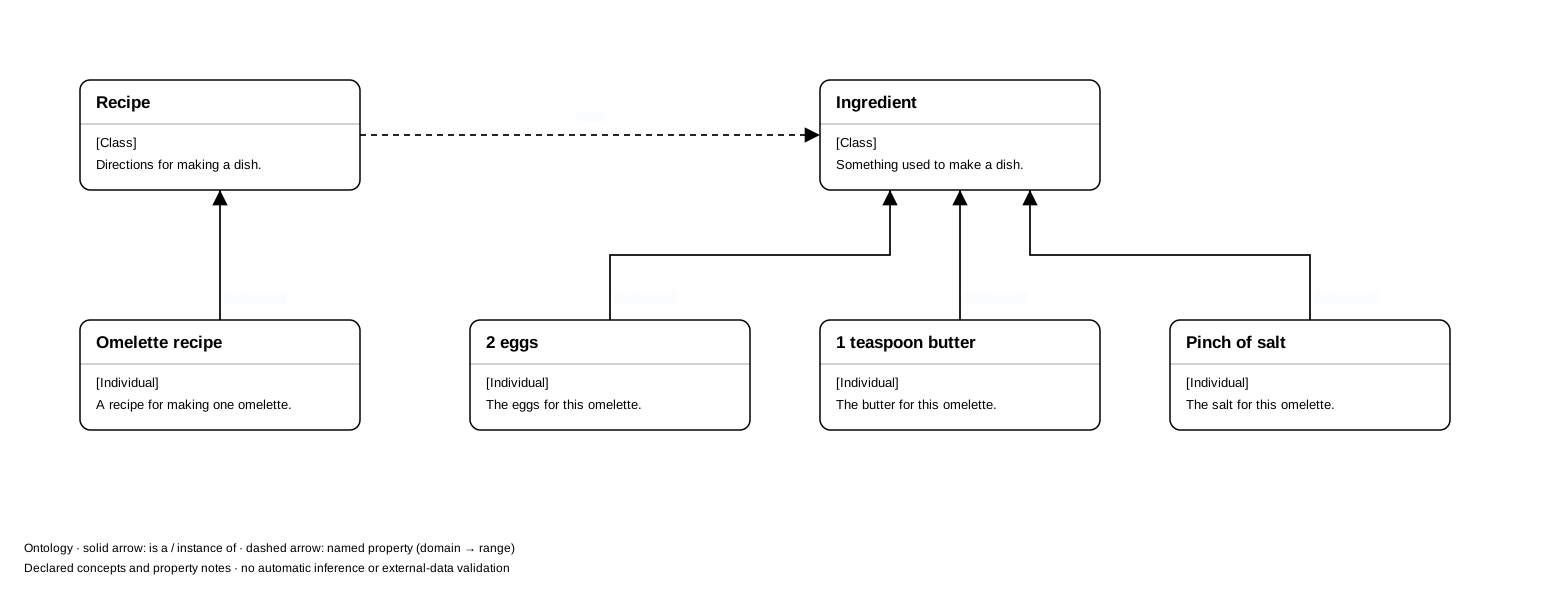
An ontology defines the concepts in a subject and how they relate. It gives people a shared vocabulary.
In cooking, a recipe uses ingredients. For one omelette, two eggs, a teaspoon of butter, and a pinch of salt are specific examples of ingredients.
State workflow
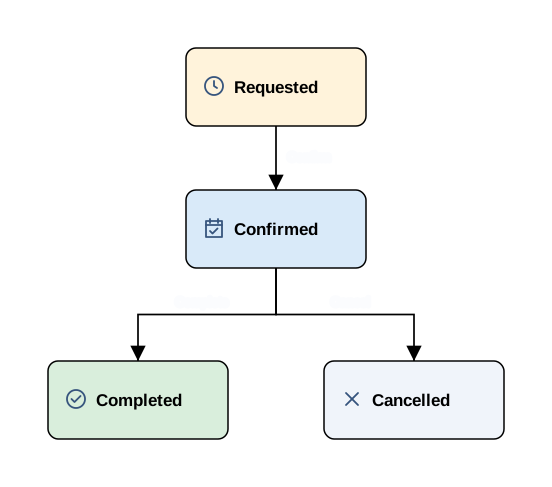
A state diagram shows what can happen next based on where something stands. Say you’ve booked an appointment and need to cancel. Once it’s confirmed, it can be completed or cancelled.
Use a state diagram to clarify the possible next steps for an appointment, an approval, or a repair.
Gantt chart
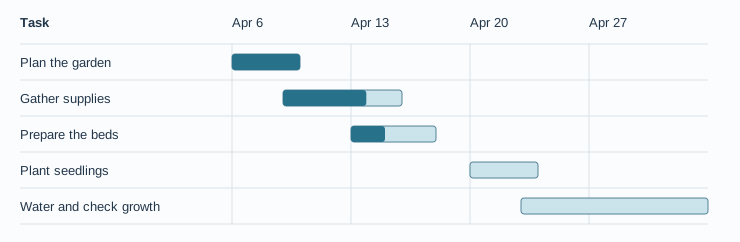
A Gantt chart shows when tasks start and finish, which ones overlap, and how much work is complete. When planting a community garden, you can gather supplies while preparing the beds, then plant once both are ready.
What’s next?
Our e-commerce and store inventory project combines explanations and ten diagrams in one document. Each diagram shows a different part of the project, such as tracking inventory or reserving stock. Read the full walkthrough for context, or explore the example and open individual diagrams in the editor.
To start your own project, open Diagram Studio in the upper-right corner and choose Create a document.
FAQ
Is KontexBI free?
Yes. KontexBI is free to use during the research phase while we continue developing it.
Do I need to sign up?
No. You can create, edit, and export diagrams in your browser without an account.
How do I create a document?
Open Diagram Studio in the upper-right corner and choose Create a document. Give your document a title and choose the diagram types you want.
How do I export a PDF?
In the editor, choose File → Export → Export PDF, then choose a paper size and tap Export. For a PDF and an editable copy in one download, choose File → Export → Download PDF + JSON.
How do I download JSON, and why keep it?
In the editor, choose File → Download JSON. The JSON file keeps the diagrams editable, so you can reopen them later or move them to another device.
How do I reopen a document for editing?
In the editor, choose File → Open JSON and select your .diagram.json file. From the homepage, Diagram Studio → Open JSON takes you to that command.
What is OPML?
OPML stands for Outline Processor Markup Language. It’s a format for moving outlines between apps. In the editor, choose File → Import → Import OPML and select an .opml file to add the outline as a new mind map. From the homepage, Diagram Studio → Import OPML takes you to the import command.
Where is my work saved?
The editor saves your work in the current browser. When an example is open, use File → Resume my document to return to your saved personal work. Download JSON to keep a copy outside the browser.
What happens when I edit an example?
Your edits stay in a demo copy in your browser. Opening a different example can replace that copy. Download its JSON to keep your edits.